



 Home


A large AI data center on a weak grid can cause severe voltage flicker and send active power swings of tens of megawatts into the grid. We modeled a 200 MVA data center in PSCAD and ran the same load profile with and without a 100 MVA E-STATCOM. Flicker fell by 59% and the grid-side active power swing fell by 44%.
| Metric at the grid connection | Without E-STATCOM | With 100 MVA E-STATCOM | Change |
|---|---|---|---|
| Short-term flicker severity, Pst | 11.3 | 4.67 | −59% |
| Peak-to-peak active power swing | 99.7 MW | 55.5 MW | −44% |
Both numbers improve, and there is still room to improve both. This article covers the setup, the results, how the model was checked, and what comes next.
1. Why AI Load Causes Flicker on a Weak Grid
Each step in data center load changes the current drawn through the grid impedance, and the bus voltage moves with it. The weaker the grid, the larger the voltage change for the same power step.
Two problems follow, and they are different problems:
Voltage flicker. Repeated voltage changes are measured as short-term flicker severity, Pst, under IEEE 1453. The interconnecting utility sets the limit.
Active power swing. The grid has to supply the megawatt swings themselves. On a weak or low-inertia system this affects frequency and nearby generation, regardless of what the voltage does.
A conventional STATCOM exchanges reactive power only. It can support voltage, but it cannot absorb or supply the megawatts. Smoothing active power needs stored energy.
2. Study Setup
| Item | Value |
|---|---|
| Tool | PSCAD (electromagnetic transient simulation) |
| Load | 200 MVA aggregated data center |
| Connection voltage | 35 kV |
| Grid strength | Short-circuit ratio (SCR) 4 |
| Load model | Step-down transformer, average-value double-conversion UPS (active rectifier, DC link, inverter), equivalent IT load |
| UPS battery | Disabled for these runs |
| Load profile | A real data center load profile |
| Compensation | 100 MVA E-STATCOM with DC-side supercapacitors, H = 4.52 s |
The UPS battery was disabled so that the results show what the E-STATCOM does on its own.
3. Results
With the E-STATCOM in service, Pst fell from 11.3 to 4.67. The peak-to-peak active power swing at the grid connection fell from 99.7 MW to 55.5 MW.
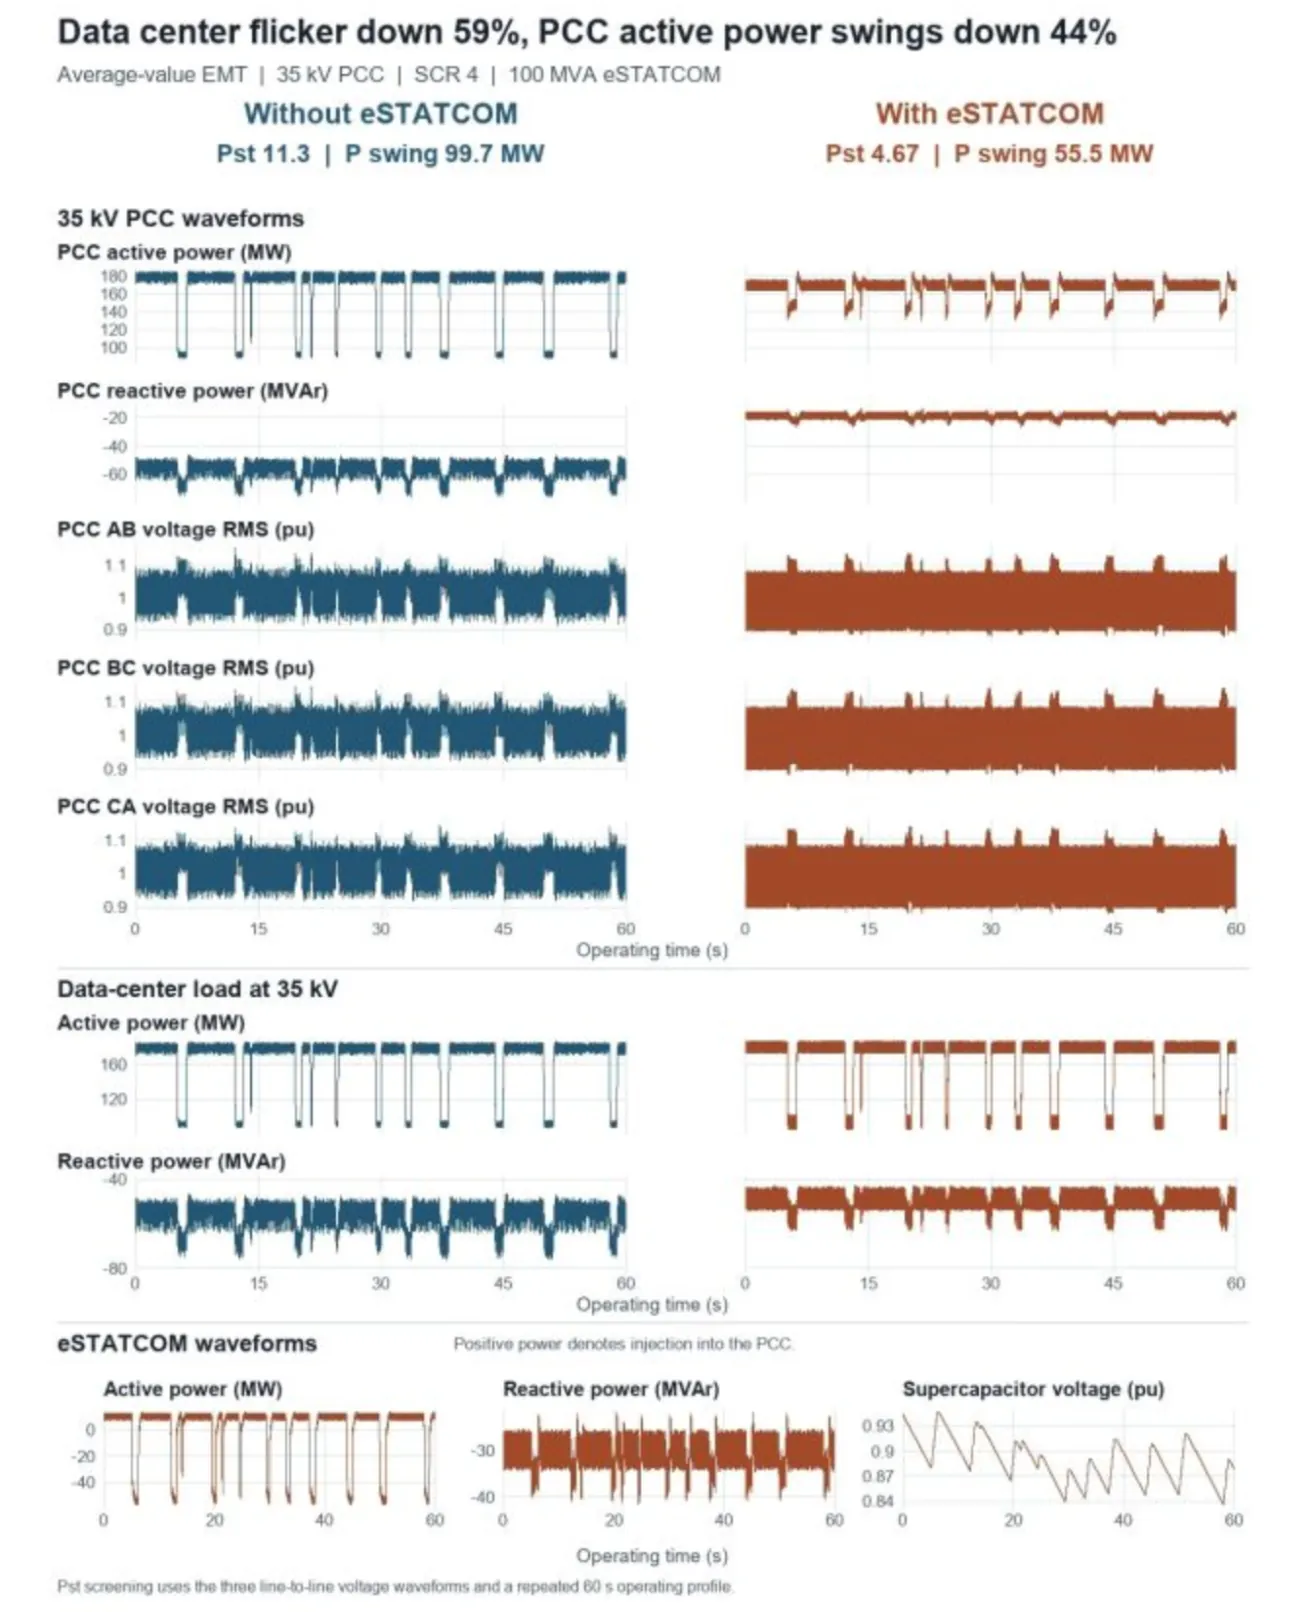
Figure 1. PSCAD results over the repeated 60 s operating profile at the 35 kV point of common coupling (PCC), without and with the 100 MVA E-STATCOM. Pst falls from 11.3 to 4.67 and the active power swing from 99.7 MW to 55.5 MW.
The E-STATCOM acts on both problems at once. Its converter regulates reactive power to hold the bus voltage. Its supercapacitors supply and absorb active power, so part of each load step is served from stored energy and not from the grid.
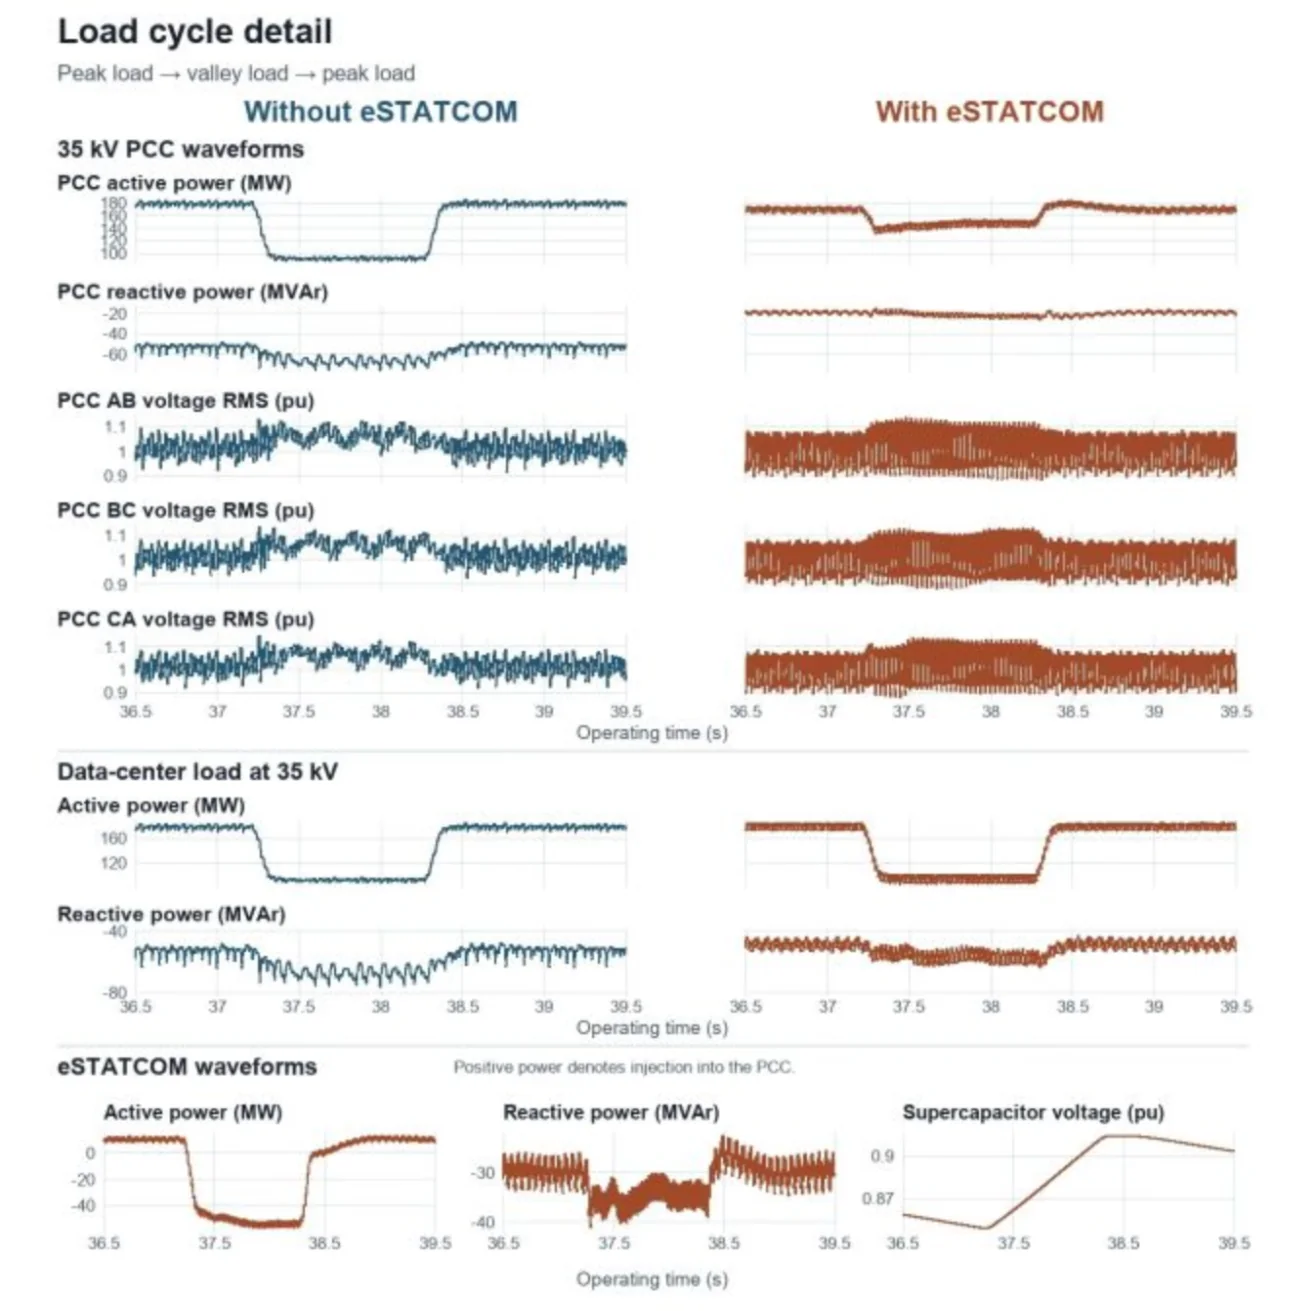
Figure 2. One load cycle in detail (peak load, valley load, peak load). The E-STATCOM absorbs active power as the load drops, and the supercapacitor voltage rises.
Neither result is the end point. Control design and hardware sizing both matter, and that is the next phase of the work (section 5).
4. Three Checks That Validated the Model
An AI assistant built the cases, applied corrections and reran them. The engineering judgment was in choosing which checks could change the conclusion. Three of them did.
Test the physics first. We replaced the E-STATCOM with an ideal voltage source behind a finite impedance. Flicker and active power swing both fell. That confirmed the approach and gave a benchmark for the converter control.
Check the direction of reactive power. In an early run, the E-STATCOM absorbed less reactive power just as the load dropped and the bus voltage rose. That is the wrong direction. The control was revised and rerun, and absorption then increased during the voltage rise.
Check what goes into the flickermeter. The first Pst figure was calculated from positive-sequence voltage. After reviewing IEEE 1453, we recalculated Pst separately for all three line-to-line voltages and reported the highest value.
Any flicker study you receive from a supplier is worth testing against the same three questions.
5. Limits of This Study and Next Steps
One load profile and one grid strength. Results will differ at other SCR values and with other workloads.
The data center is an aggregated, average-value model. It does not represent individual UPS units or switching harmonics.
Both metrics still have room to improve.
Next, we will benchmark a fast planning model against the PSCAD results. The aim is to find the minimum converter rating and supercapacitor energy that meet both targets across representative load profiles and grid strengths.
6. Data to Send for a Sizing Study
To size compensation for a data center connection, we need:
Time-resolved load profile at the point of interconnection
Short-circuit level or SCR at the point of interconnection, and the X/R ratio
Connection voltage and step-down transformer data
UPS topology and whether UPS batteries take part in load smoothing
The utility's flicker and ramp-rate requirements
Sieyuan's E-STATCOM is available up to ±300 MVA with up to ±200 MW active power, for 50 Hz or 60 Hz systems, in grid-forming or grid-following mode. See the E-STATCOM product page and our data center solutions.